

What Is Mode in Math?
When students search for "what is mode in math," they're often confused about how it differs from mean and median, struggling with basic statistics homework, or preparing for an upcoming test. If you've ever wondered what mode means in mathematics or how to calculate it quickly, you're in the right place. This comprehensive guide will break down the definition of mode in math, show you simple formulas and step-by-step methods, provide clear examples, and explain how mode compares to other measures of central tendency like mean and median. Whether you're a student, parent, or educator, this article is designed for quick learning with classroom-friendly explanations optimized for both traditional and AI-powered search.

What Is Mode in Math?
Mode in math is the value that appears most frequently in a set of numbers
“Mode in math is the value that appears most frequently in a set of numbers. To find the mode, list the data, count how often each number occurs, and choose the value with the highest frequency. A data set may have one mode, more than one mode, or no mode at all. Mode is useful for identifying common patterns such as the most popular item, most frequent score, or most common measurement.”
What Is Mode in Math?
Mode is the value that appears most frequently in a data set. It's one of three main measures of central tendency in statistics, alongside mean and median. Understanding what is the definition of mode in math is essential for analyzing data and identifying patterns.
For example:
In the data set 2, 3, 3, 5 → the mode is 3 (it appears twice)
In 7, 9, 9, 9, 12 → the mode is 9 (it appears three times)
What is the meaning of mode in math? Simply put, mode tells us which value occurs most often. This makes it incredibly useful in everyday situations, like determining the most common shoe size sold in a store, the most popular ice cream flavor, or the most frequent test score in a classroom.
Think of mode like this: If you surveyed your classmates about their favorite color, the mode would be the color that got the most votes. It's all about popularity and frequency!
Key Characteristics of Mode
Mode is fundamentally about frequency — how many times each value appears. Understanding what is the mode in maths definition involves recognizing these key characteristics:
A data set can have:
One mode (unimodal) — when one value appears most frequently
Two modes (bimodal) — when two values tie for appearing most frequently
More than two modes (multimodal) — when multiple values share the highest frequency
No mode — when all values appear with equal frequency or each appears only once
Why Mode Matters in Statistics
Mode serves several important purposes in mathematics and real-world applications:
Perfect for categorical data: Unlike mean, mode works with non-numeric data (like colors, names, or categories)
Reveals trends in surveys: Helps identify the most common response or preference
Simple measure of central tendency: Easy to understand and calculate without complex formulas
Practical applications: Used in business, education, science, and everyday decision-making
As K-12 math experts, we also covered the topic What Is a Tessellation in Math — have a look!
How to Find the Mode in Math (Step-by-Step)
Finding the mode is straightforward when you follow these simple steps. This method works for any type of numerical data set.
Step 1 — List All Numbers Clearly
Write out all the numbers in your data set. You don't necessarily need to arrange them in order, but organizing them can help you spot patterns more easily.
Example: 4, 7, 2, 7, 9, 7, 3
Listing your data clearly helps you identify which numbers are duplicates and prevents you from missing any values.
Step 2 — Count Frequency of Each Number
Count how many times each unique number appears in your data set. Creating a simple frequency table can be helpful:
Example 1:
Data set: 4, 7, 2, 7, 9, 7, 3
Frequency count:
2 appears 1 time
3 appears 1 time
4 appears 1 time
7 appears 3 times
9 appears 1 time
Example 2:
Data set: 5, 8, 5, 12, 8, 5
Frequency count:
5 appears 3 times
8 appears 2 times
12 appears 1 time
Step 3 — Identify the Number Appearing the Most
Look for the value with the highest frequency. This is your mode.
Micro Examples:
In 1, 2, 2, 3, 4 → mode is 2
In 10, 15, 15, 15, 20, 25 → mode is 15
In 6, 6, 6, 8, 8, 8 → modes are 6 and 8 (bimodal)
Step 4 — Handle Special Cases (No Mode, Bimodal, Multimodal)
Sometimes data sets don't follow simple patterns. Here's how to handle special situations:
No Mode:
When all numbers appear with the same frequency
Example: 1, 2, 3, 4, 5 (each appears once) = no mode
Bimodal:
When two values tie for highest frequency
Example: 3, 3, 7, 7, 9 → modes are 3 and 7
Multimodal:
When more than two values share the highest frequency
Example: 2, 2, 5, 5, 8, 8 → modes are 2, 5, and 8
Important: When a data set has no mode or multiple modes, simply state that fact. There's no need to force a single answer.
Practice Mode!
Practice Mode through the HYE Tutors Mode Module and master the order of operations through guided examples, step-by-step problem sets, and instant feedback to build accuracy and confidence in solving multi-step expressions!
Examples of Mode in Different Types of Data
Mode can be found in various types of numerical data. Let's explore different scenarios to strengthen your understanding.
Example 1 — Whole Numbers
Problem: Find the mode of 12, 15, 12, 18, 20, 12, 15
Solution:
List the data: 12, 15, 12, 18, 20, 12, 15
Count frequencies:
12 appears 3 times
15 appears 2 times
18 appears 1 time
20 appears 1 time
Mode = 12 (highest frequency)
Example 2 — Mode with Decimals
Mode works perfectly with decimal numbers too! The concept remains the same.
Problem: Find the mode of 3.5, 4.2, 3.5, 5.1, 3.5, 4.2
Solution:
Count frequencies:
3.5 appears 3 times
4.2 appears 2 times
5.1 appears 1 time
Mode = 3.5
Example 3 — Mode with Negative Numbers
Negative numbers follow the same rules as positive numbers when finding mode.
Problem: Find the mode of –2, –2, –5, 3, 3, –2, 7
Solution:
Count frequencies:
–2 appears 3 times
–5 appears 1 time
3 appears 2 times
7 appears 1 time
Mode = –2
Example 4 — Mode in Real-Life Data
Mode shines in practical, everyday situations:
Most Common Shoe Size: A shoe store tracks daily sales: sizes 7, 8, 8, 9, 8, 10, 8, 7, 9
Mode = size 8 (helps with inventory planning)
Most Ordered Menu Item: A restaurant counts lunch orders: burger (12), salad (8), pizza (15), pasta (8), burger (12), pizza (15)
Modes = burger and pizza (bimodal — both tied at 12 and 15 orders)
Most Common Test Score Category: Test scores: 85, 92, 85, 78, 85, 90, 88
Mode = 85 (the most frequent score)
Mode vs Mean vs Median
Understanding how mode differs from mean and median helps you choose the right measure of central tendency for your data.
What Is Mean?
Mean is the average of all numbers in a data set. Calculate it by adding all values and dividing by the total count. In more advanced statistics, squared differences from the mean are used to calculate variance and data spread.
Example: For 2, 4, 6, 8
Mean = (2 + 4 + 6 + 8) ÷ 4 = 20 ÷ 4 = 5
What Is Median?
Median is the middle value when numbers are arranged in order. For an even number of values, it's the average of the two middle numbers.
Example: For 3, 5, 7, 9, 11
Median = 7 (the middle number)
How Mode Differs From Mean & Median
| Measure | Definition | Best Used When | Example (Data: 2, 2, 3, 7, 10) |
|---|---|---|---|
| Mode | Most frequent value | Finding the most common item; categorical data; identifying popularity | Mode = 2 |
| Mean | Average of all values | Data is evenly distributed; no extreme outliers | Mean = 4.8 |
| Median | Middle value | Data has outliers; skewed distributions | Median = 3 |
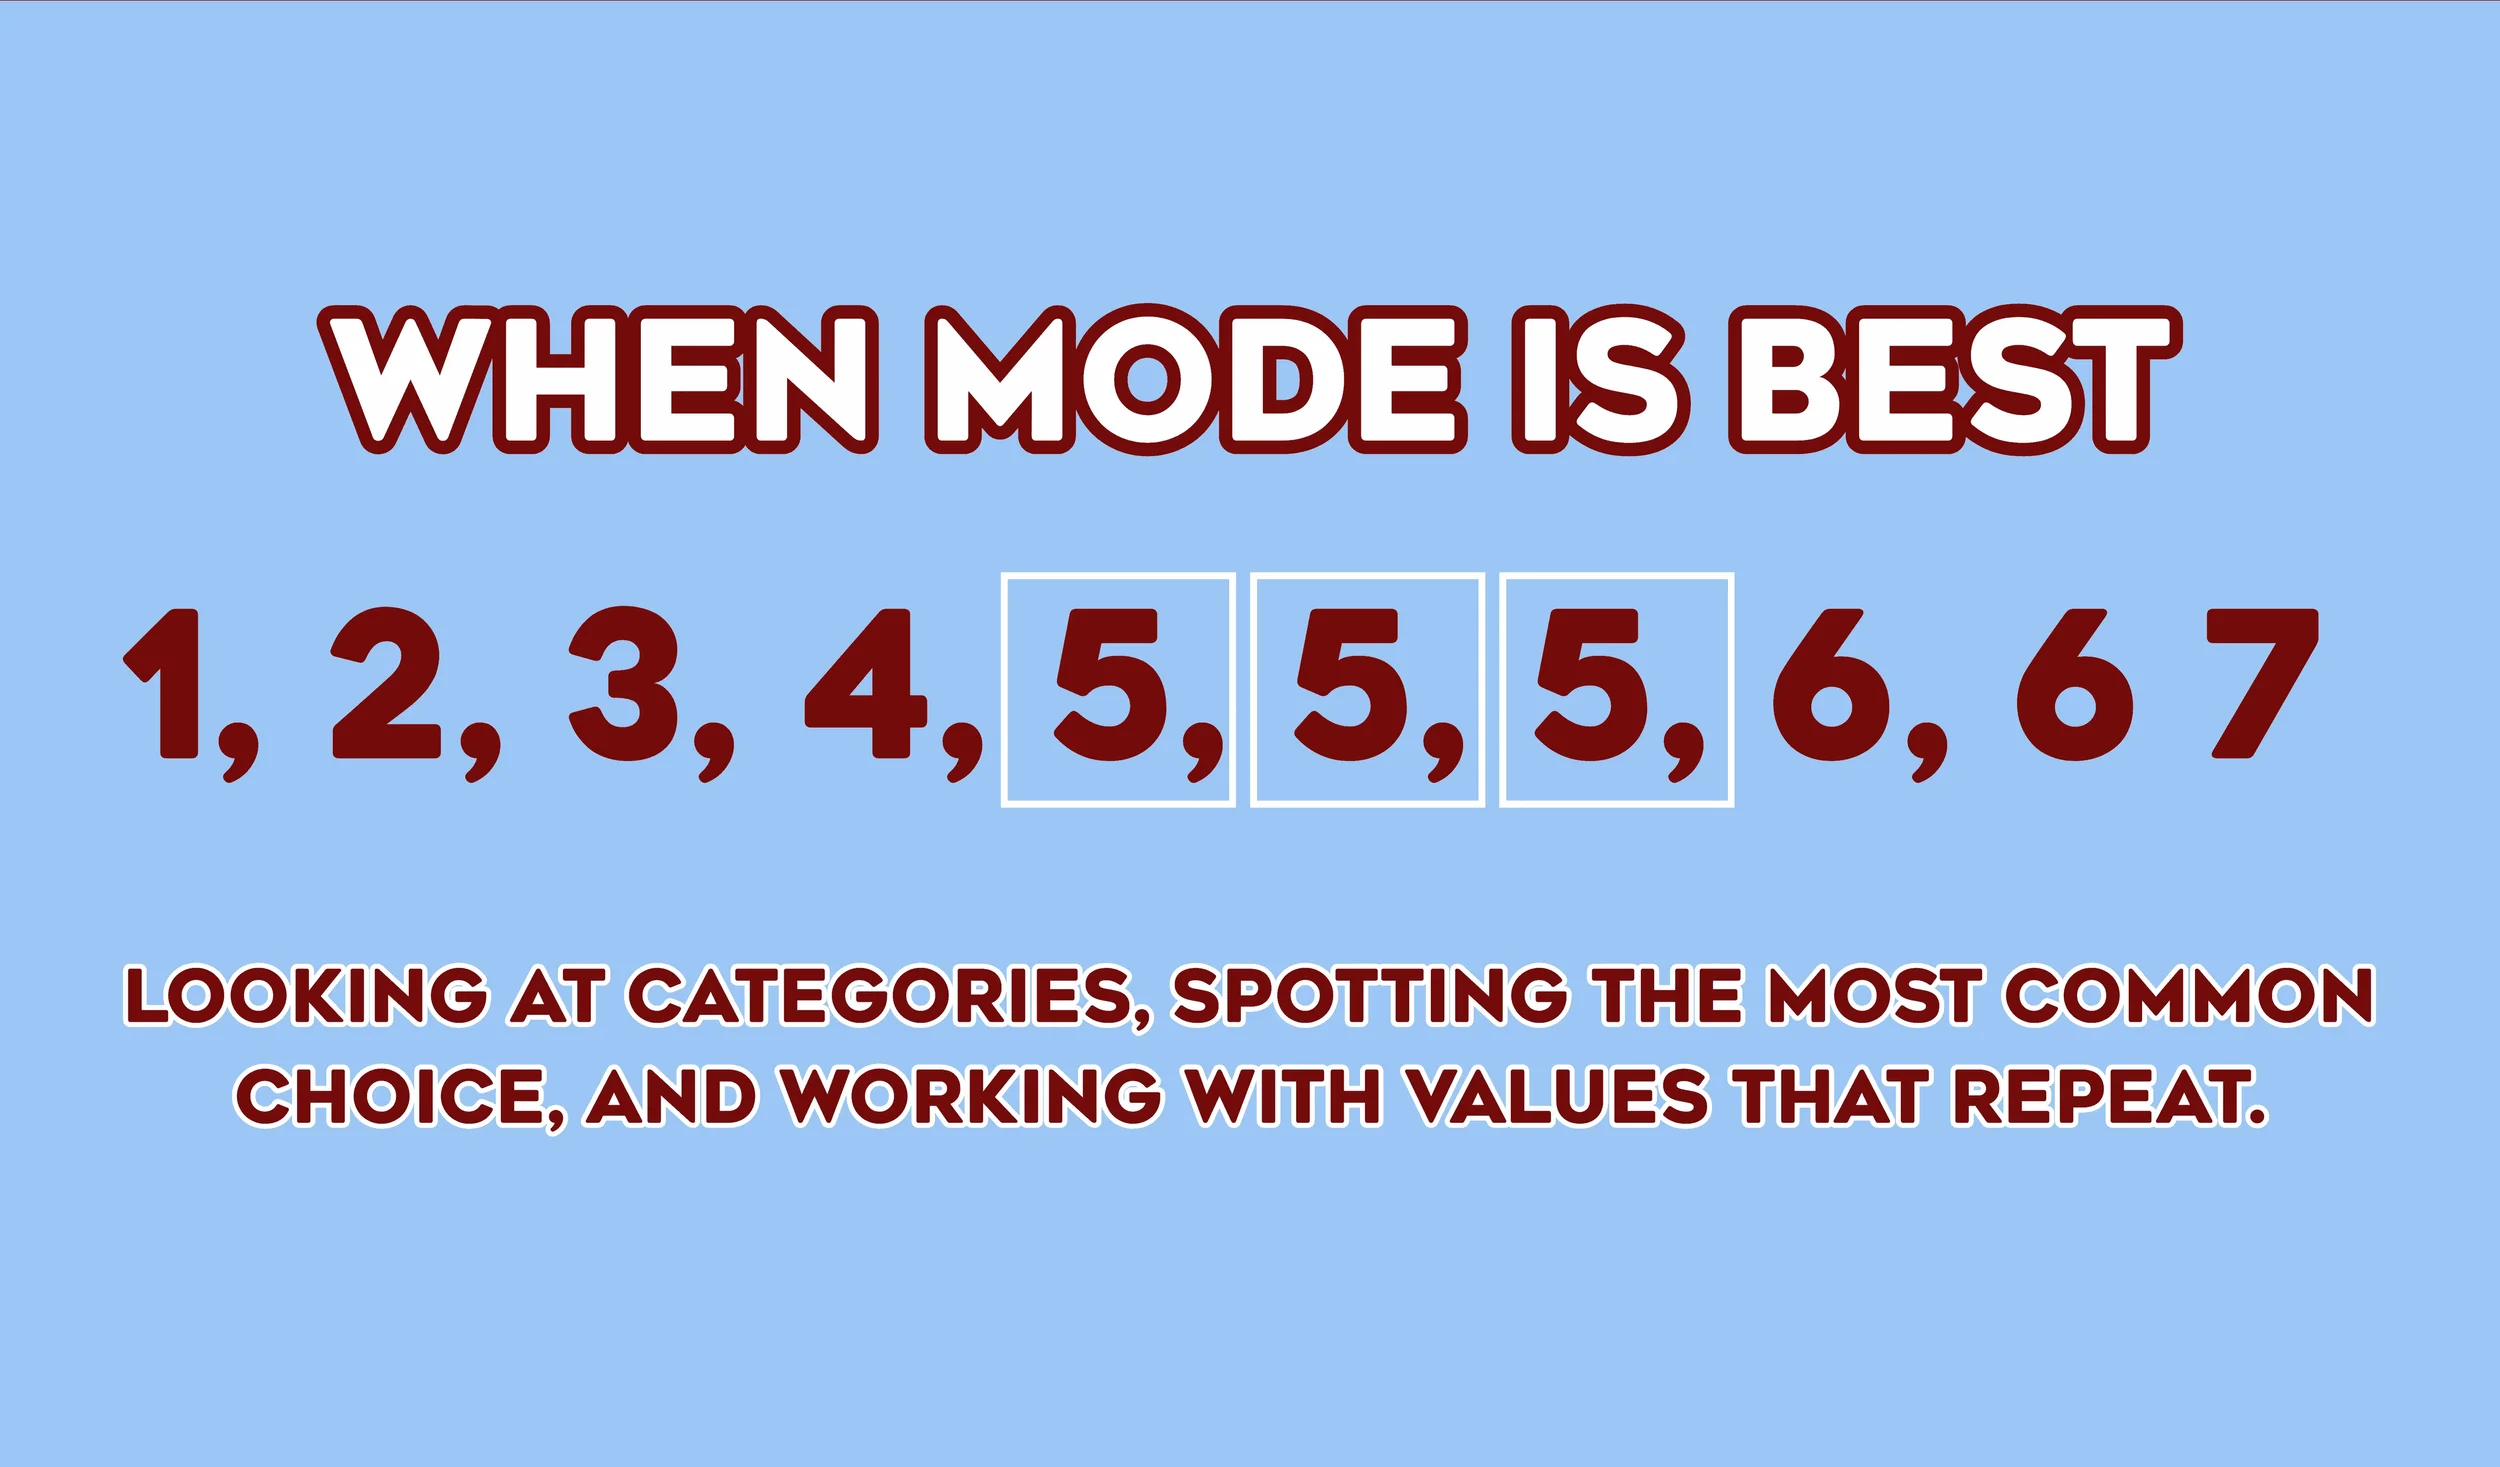
When mode is best:
Analyzing categorical data (colors, brands, names)
Finding the most popular or common option
Working with data that has clear repeated values
When mean is best:
Data is normally distributed without extreme outliers
You need to account for all values equally
Calculating typical performance or average results
When median is best:
Data contains outliers that would skew the mean
Working with income data or home prices
Distribution is skewed left or right
Understanding what is mean median and mode in math helps you analyze data more effectively. Each measure tells a different story about your data set, and knowing what is mode median and mean in maths allows you to choose the most appropriate tool for your analysis.
As experienced K-12 math tutors, we cover mean, median, mode, and range together in one helpful article, with examples and practical tips. See it here!
What Is "Mod" in Math? (Not the Same as Mode)
Students often confuse "mode" with "mod" — but they're completely different concepts!
Mod (short for modulo) is a mathematical operation that finds the remainder when one number is divided by another. It's written as "a mod b" and used extensively in computer science, cryptography, and number theory.
Examples of Mod:
12 mod 5 = 2
When you divide 12 by 5, you get 2 with a remainder of 2
The mod operation gives you just the remainder: 2
17 mod 4 = 1
17 ÷ 4 = 4 remainder 1
Therefore, 17 mod 4 = 1
20 mod 6 = 2
20 ÷ 6 = 3 remainder 2
Therefore, 20 mod 6 = 2
Key Differences:
Mode = the most frequent value in a data set (statistics)
Mod = the remainder after division (arithmetic operation)
When searching "what is mod in math" versus "what is mode in math," remember: mod involves division and remainders, while mode involves counting frequency. Understanding what is mod in maths helps prevent confusion with mode.
Mode in Math Terms (Extended Definitions)
For a more formal, textbook-style understanding, here are extended definitions of mode:
Formal Definition: The mode is the value or values in a data set that occur with the greatest frequency. It represents the most commonly observed outcome in a collection of observations.
Statistical Definition: In descriptive statistics, the mode is a measure of central tendency that identifies the peak of the frequency distribution — the point at which data clusters most densely.
Alternative Terms:
Most frequent value
Highest frequency data point
Most common observation
Peak value in a frequency distribution
Modal value
Mathematical Notation: While mode doesn't have a universal symbol like mean (x̄) or median (M), it's sometimes represented as "Mo" in statistical formulas and textbooks.
The mode is unique among measures of central tendency because it's the only one that can be used with nominal (categorical) data, making it incredibly versatile for real-world applications.
Types of Mode
Data sets can have different modal patterns depending on how values repeat. Recognizing these patterns helps you describe your data accurately.
Unimodal
A unimodal distribution has exactly one mode — one value appears more frequently than all others.
Example: 5, 7, 9, 9, 9, 11, 13
Mode = 9 (appears three times)
This is the most common scenario in data sets
Bimodal
A bimodal distribution has exactly two modes — two values tie for the highest frequency.
Example: 3, 3, 3, 6, 8, 10, 10, 10, 12
Modes = 3 and 10 (both appear three times)
Often indicates two distinct groups or patterns in the data
Multimodal
A multimodal distribution has more than two modes — multiple values share the highest frequency.
Example: 2, 2, 2, 5, 5, 5, 8, 8, 8, 11
Modes = 2, 5, and 8 (all appear three times)
Suggests complex patterns or multiple subgroups
No Mode
A data set has no mode when all values appear with equal frequency or each value appears only once.
Example: 4, 7, 12, 15, 23
No mode (each number appears exactly once)
Common in small, diverse data sets
Practice Problems (With Answers)
Test your understanding with these practice problems. Try solving them before checking the answers!
Problems:
Find the mode: 8, 12, 8, 15, 8, 20, 12
Find the mode: 3.5, 4.2, 3.5, 5.8, 4.2, 3.5
Find the mode: 100, 200, 300, 400, 500
Find the mode: –5, –3, –5, 0, 2, –5, 4
Find the mode: 7, 7, 9, 9, 11, 11, 13
Find the mode: red, blue, red, green, blue, red, yellow
Find the mode: 25, 30, 25, 35, 30, 25, 40
Find the mode: 1.1, 2.2, 3.3, 4.4, 5.5, 6.6
Find the mode: 6, 8, 6, 10, 8, 12, 6, 8
Find the mode: 50, 50, 75, 75, 100, 100
Answers:
Mode = 8 (appears 3 times)
Mode = 3.5 (appears 3 times)
No mode (all values appear once)
Mode = –5 (appears 3 times)
No mode (7, 9, and 11 each appear twice — multimodal, but some consider this no clear mode)
Mode = red (appears 3 times)
Mode = 25 (appears 3 times)
No mode (all values appear once)
Modes = 6 and 8 (bimodal — both appear 3 times)
Modes = 50, 75, and 100 (multimodal — all appear twice)
Common Mistakes Students Make When Finding the Mode
Avoid these frequent errors to find the mode accurately every time:
Confusing Mode with Median Students sometimes mix up the middle value (median) with the most frequent value (mode). Remember: mode is about repetition, not position.
Not Sorting Data First While sorting isn't required, failing to organize data makes it harder to spot repeated values. Consider arranging numbers in order to avoid missing duplicates.
Forgetting That Non-Numeric Values Can Have a Mode Mode works with categories too! Colors, names, brands, and other categorical data can have modes based on which category appears most often.
Misinterpreting "No Mode" Scenarios When all values appear equally, students sometimes incorrectly list all numbers as the mode. The correct answer is "no mode" or "no clear mode exists."
Counting Values Instead of Frequency Some students count how many different numbers exist rather than how many times each number appears. Focus on repetition, not variety.
Assuming There's Always One Mode Data sets can have zero, one, two, or many modes. Don't force a single answer when the data shows multiple modes or none at all.
FAQs — Frequently Asked Questions
How do you find the mode easily?
The easiest way to find the mode is to list all numbers, count how often each appears, and identify which value has the highest count. Creating a simple tally or frequency table speeds up the process.
Can a data set have more than one mode?
Yes! A data set can have two modes (bimodal), three or more modes (multimodal), or no mode at all. Multiple modes occur when two or more values tie for the highest frequency.
What if all numbers appear only once?
If every number in the data set appears exactly once with equal frequency, then the data set has no mode. This is perfectly normal for certain types of data.
What is the difference between mode and mean?
Mode is the most frequent value, while mean is the average of all values. Mode focuses on repetition; mean considers all numbers equally regardless of how often they appear.
Why do we use mode in statistics?
Mode is valuable because it works with both numerical and categorical data, identifies the most common outcome, isn't affected by extreme values, and provides quick insights into data patterns.
Is mode always a number?
No! Mode can be any type of data value — numbers, words, colors, categories, or any other observable characteristic. This versatility makes mode unique among measures of central tendency.
Can decimals have a mode?
Absolutely! Decimal numbers follow the same rules as whole numbers. If 3.5 appears more frequently than other decimals in your data set, then 3.5 is the mode.
What is the mode in maths for kids?
For kids, think of mode as the "winner" of the data set — it's the number that shows up the most times, like the most popular answer in a class survey or the favorite snack that most students choose.
What is mod vs mode?
Mod is a math operation that finds the remainder after division (example: 17 mod 5 = 2). Mode is the most frequent value in a data set. They're completely different concepts with similar names.
When is mode the best measure of central tendency?
Mode is best when analyzing categorical data, identifying the most popular option, working with data that has clear peaks, or when outliers would distort the mean. It's perfect for finding "what's most common."
Conclusion
Understanding what is mode in math empowers you to analyze data effectively and identify meaningful patterns in numbers. Mode represents the most frequently occurring value in a data set, making it an essential tool in statistics, everyday decision-making, and academic success. Whether you're working with whole numbers, decimals, negative values, or even categorical data like colors and names, the mode provides quick insights into what's most common.
Remember that finding the mode involves three simple steps: list your data, count the frequency of each value, and identify which appears most often. Practice with various examples to build confidence, and don't forget that data sets can be unimodal, bimodal, multimodal, or have no mode at all.
By mastering mode alongside mean and median, you'll have a complete toolkit for describing and understanding data. Keep practicing with the examples provided, work through the practice problems, and apply these concepts to real-world situations. The more you work with mode, the more natural it becomes.
Ready to explore more math concepts? Visit hyetutors.com for comprehensive guides on mean, median, range, standard deviation, and other essential mathematics topics that will strengthen your statistical skills and boost your academic confidence.