

What Is Mean, Median and Mode and Range in Math?
If you've ever wondered what is mean, median and mode and range in math, you're exploring four fundamental concepts that help us understand and describe data. Students often struggle to remember which measure is which, confuse the calculations, or don't understand when to use each one. These four measures—mean (average), median (middle value), mode (most frequent), and range (spread)—work together to summarize sets of numbers in different but complementary ways.
This comprehensive guide will explain each measure clearly, show you step-by-step how to calculate them, provide worked examples using the same data set, and help you understand when to use each measure. Whether you're analyzing test scores, temperatures, survey results, or any collection of numbers, these basic statistical tools make data meaningful and accessible. By the end of this guide, you'll confidently identify and calculate all four measures. Let's explore these essential concepts with practical examples and clear explanations.
What Is Mean, Median and Mode and Range in Math?
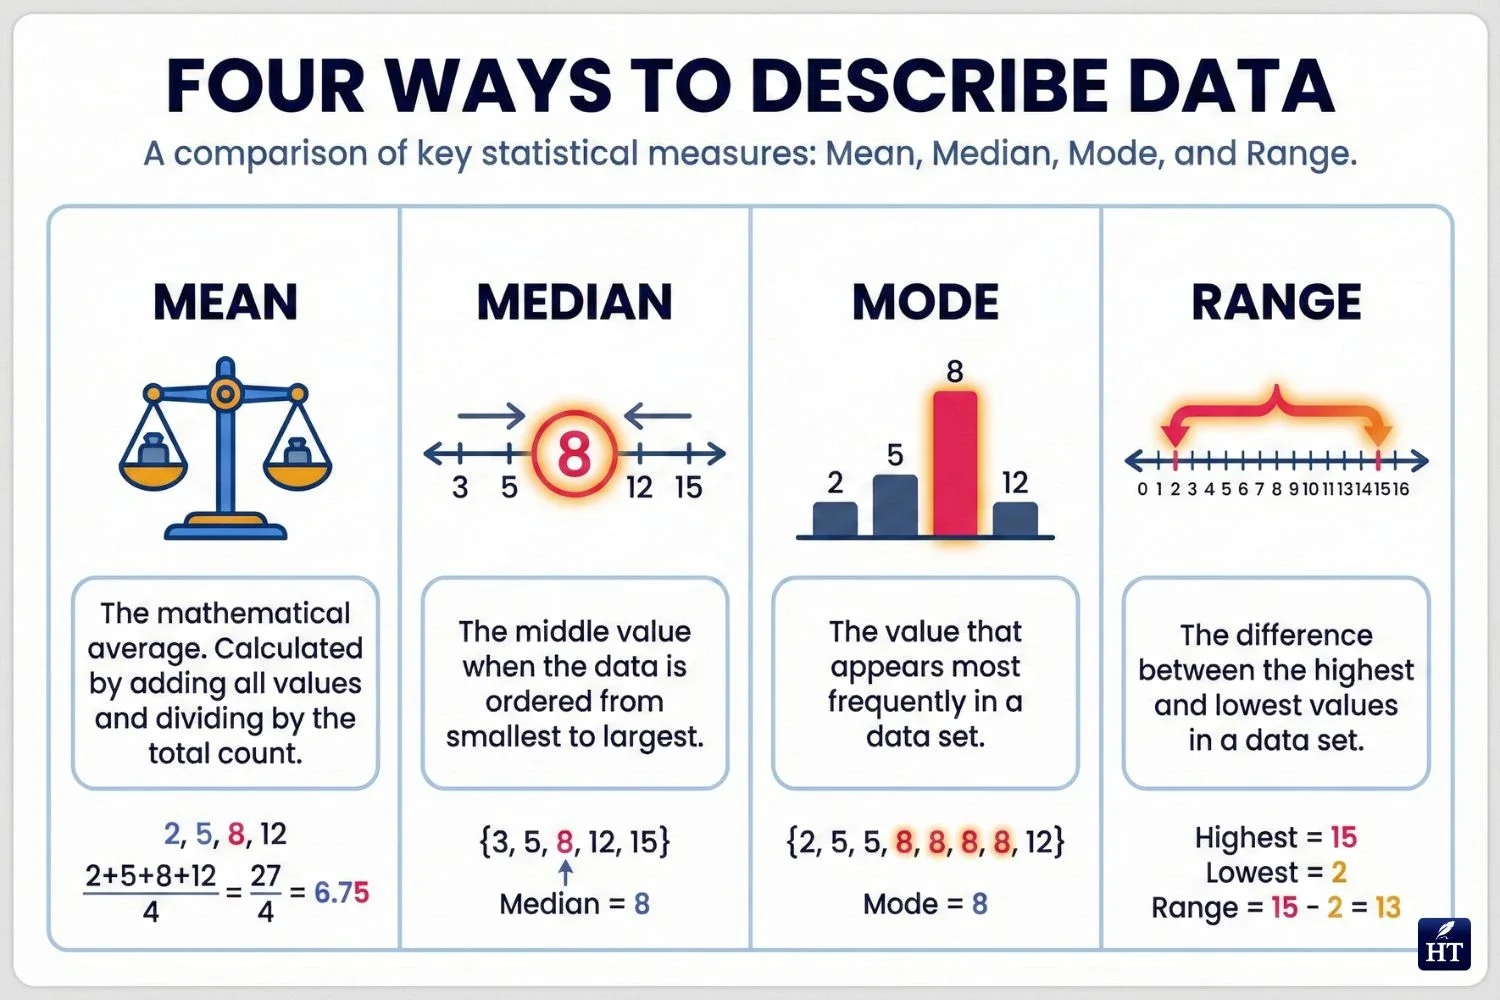
Mean, median, mode, and range are basic measures used in math to describe a set of numbers. The mean is the average, the median is the middle value, the mode is the most frequent value, and the range shows how spread out the numbers are. These measures help summarize and analyze data in a simple way.
What Are Mean, Median, Mode, and Range in Math?
Understanding what is mean median and mode and range in math starts with recognizing why these four measures are taught together. They are the foundational tools of descriptive statistics—methods for summarizing and understanding collections of numbers without complex mathematics. Each measure reveals something different about your data, and together they provide a comprehensive picture.
Why we use these measures together:
When you have a set of numbers—test scores, temperatures, prices, measurements—you need ways to describe the data efficiently. Instead of listing every single number, these four measures let you communicate:
What's typical or average (mean)
What's in the middle (median)
What appears most often (mode)
How spread out the values are (range)
What is mean median mode and range in maths and what is the mean median mode and range in math are common variations of the same question, all asking how to summarize numerical data sets using these four key measures.
These concepts appear throughout middle school and high school mathematics, forming the foundation for more advanced statistics, probability, and data analysis. Let's examine each measure individually to understand what it tells us.
Mean — What It Is and What It Shows
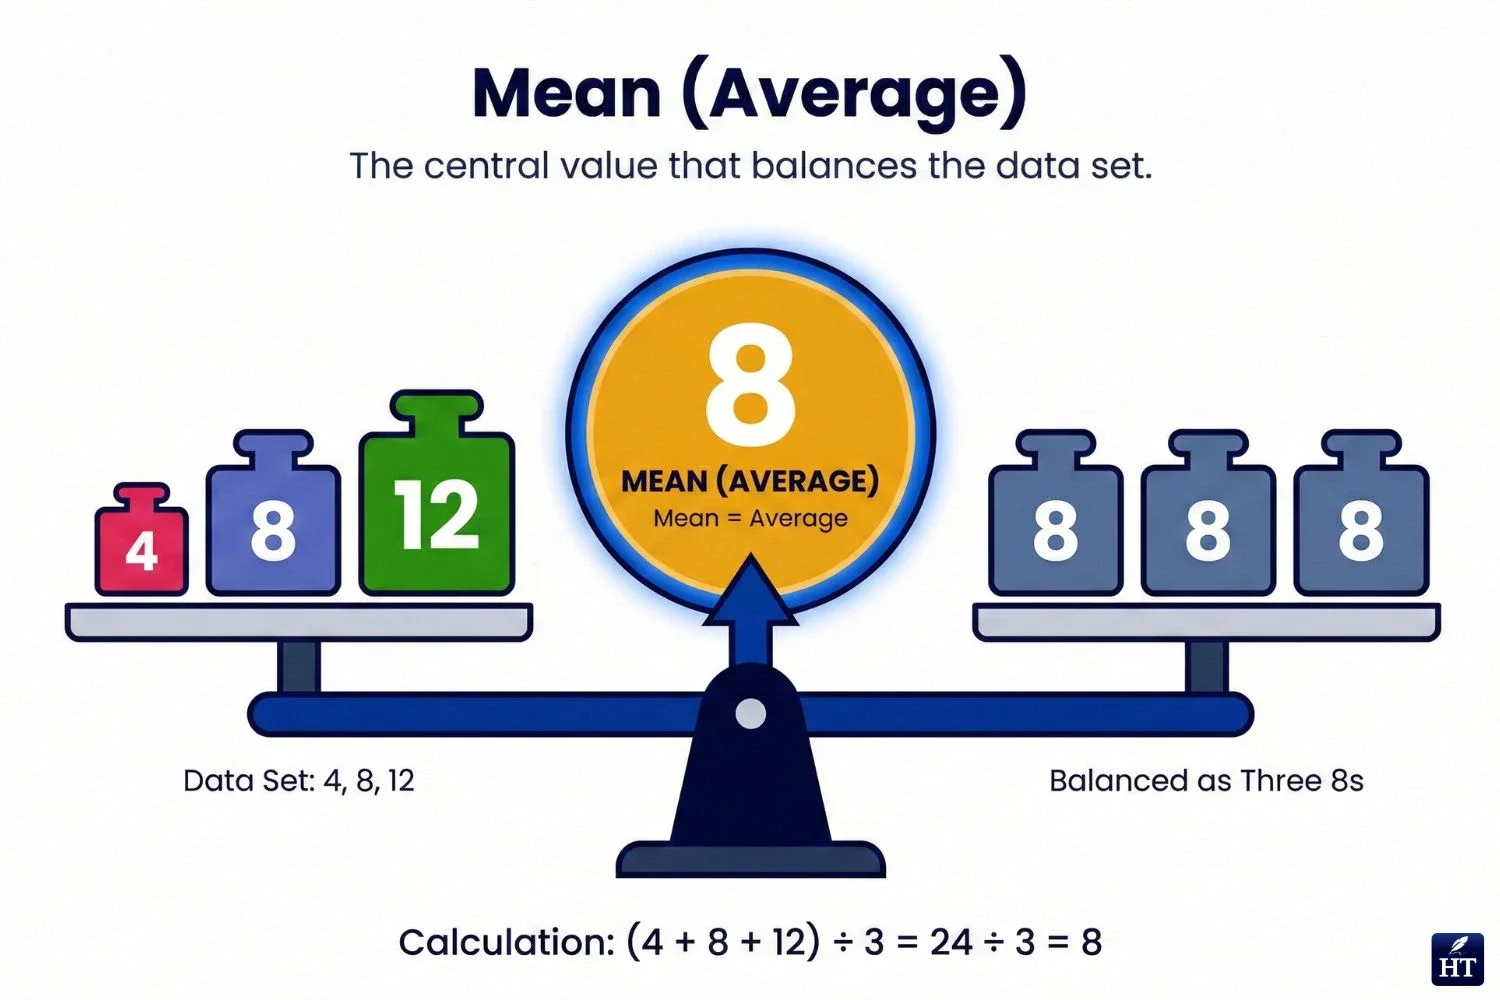
The mean is the average of a set of numbers—the sum of all values divided by how many values there are. It represents a "typical" or "central" value that balances all the numbers in your data set.
Formula: Mean = (Sum of all values) ÷ (Number of values)
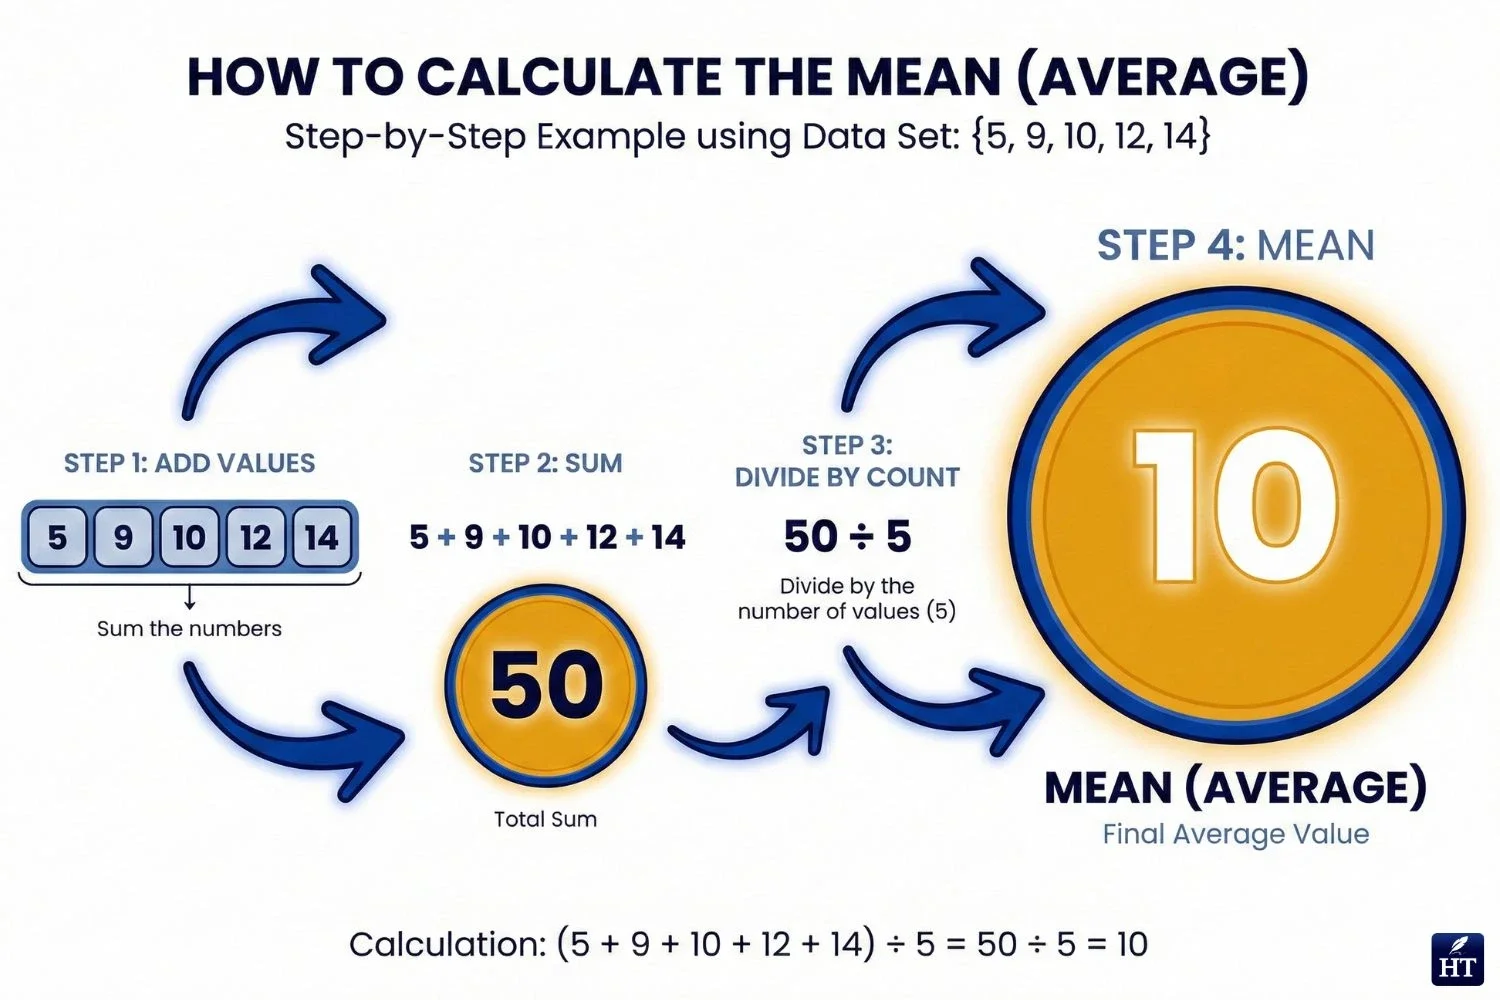
Simple example: Find the mean of: 4, 7, 10, 13, 16
Calculation:
Sum: 4 + 7 + 10 + 13 + 16 = 50
Count: 5 numbers
Mean: 50 ÷ 5 = 10
Before diving into measures like mean and median, always follow the order of operations when performing any calculations
What the mean shows: The mean gives you one number that represents the entire data set. If all the values were equal, they would all be the mean.
Real-life context:
Test scores: If you scored 85, 90, 88, 92, and 95 on five tests, your mean score is 90
Temperatures: Average daily temperature helps you understand typical weather
Spending: Average monthly expenses help with budgeting
The mean is useful when you want one number that balances all your data, but it can be affected by extremely high or low values (outliers).
Median — Finding the Middle Value
The median is the middle number when data is arranged in order from smallest to largest. Half the values fall below the median, and half fall above it.
How to find the median:
Arrange numbers in order (smallest to largest)
Find the middle value
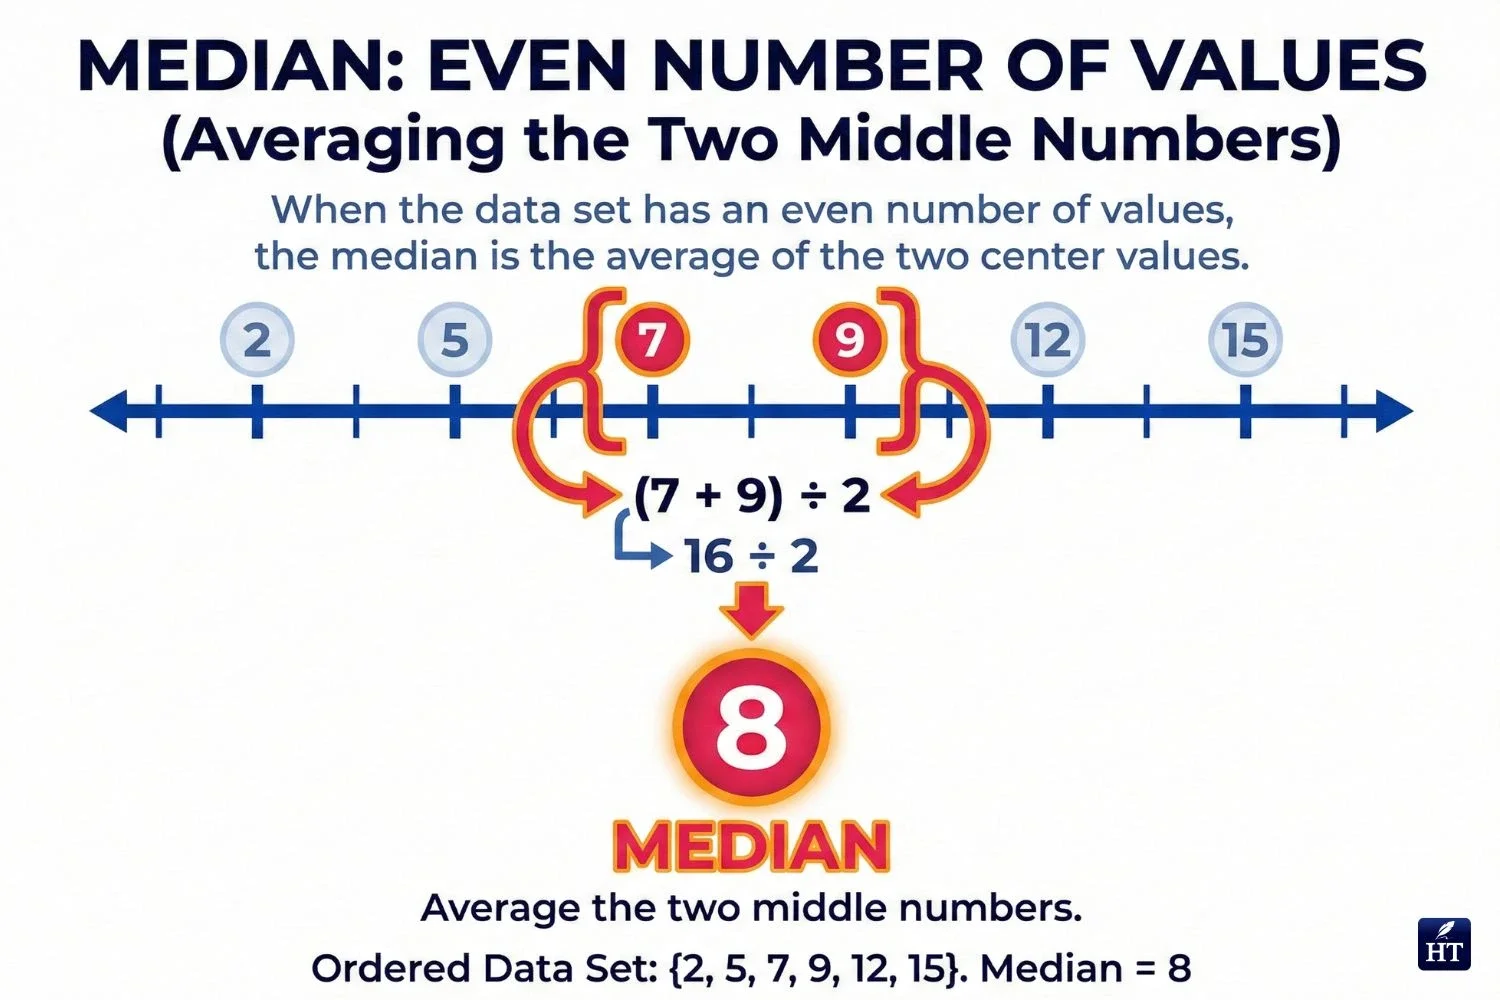
If there's an even number of values, average the two middle numbers
Example with odd number of values: Find the median of: 3, 7, 2, 9, 5
Steps:
Order: 2, 3, 5, 7, 9
Middle position: 3rd value
Median: 5
Example with even number of values: Find the median of: 4, 8, 2, 10
Steps:
Order: 2, 4, 8, 10
Middle positions: 4 and 8
Average: (4 + 8) ÷ 2 = 6
Median: 6
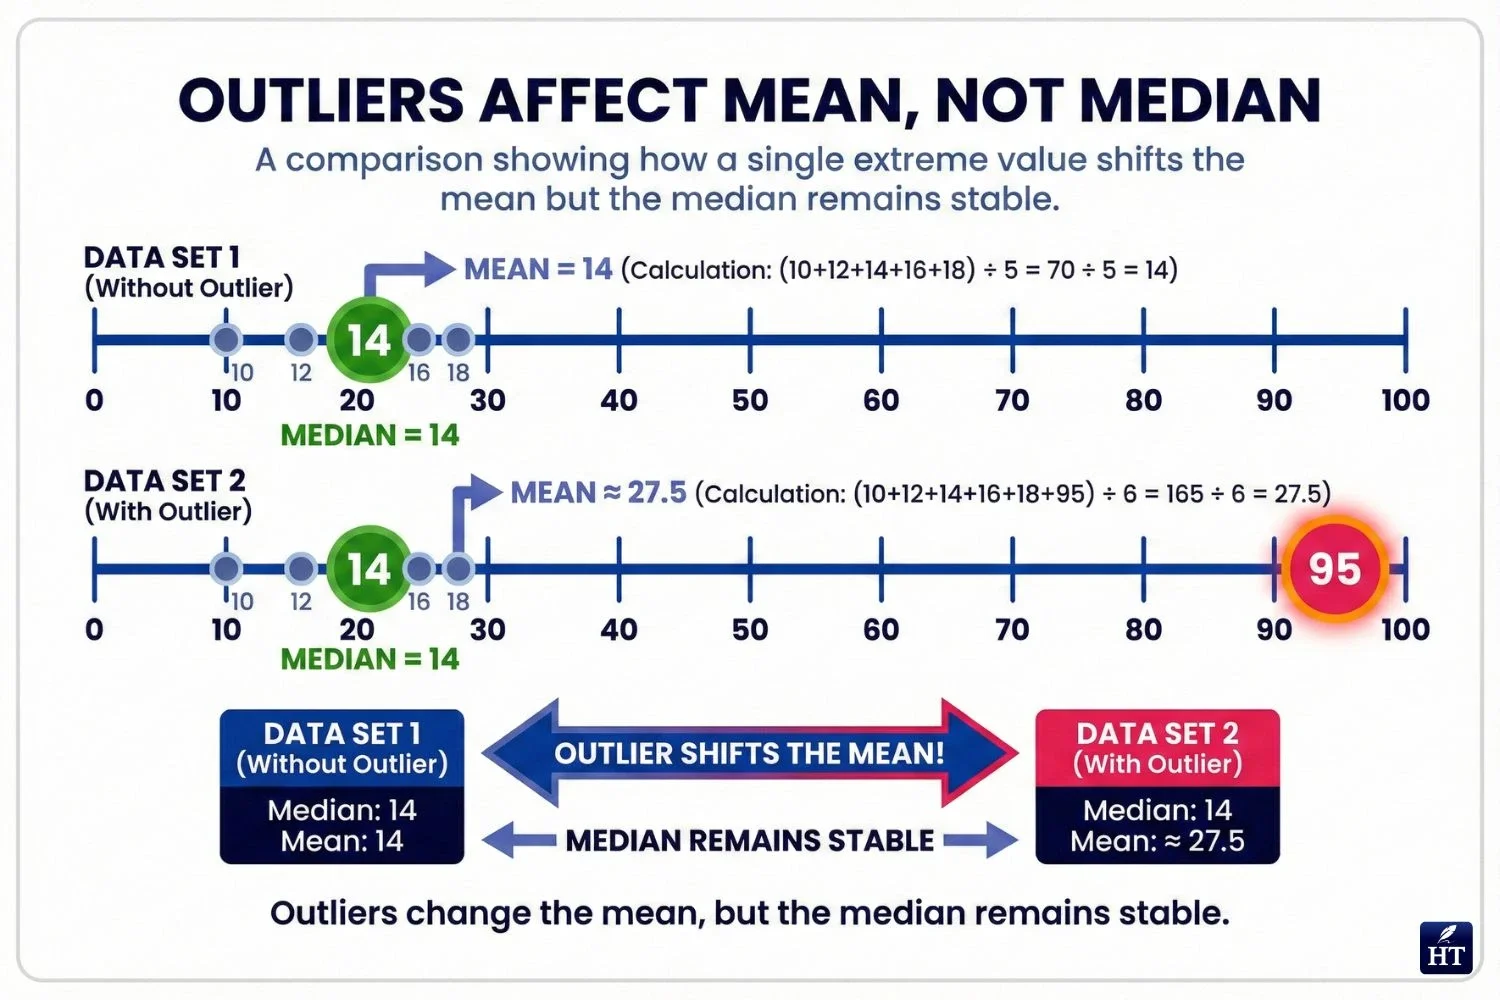
When median is more useful than mean: The median isn't affected by extreme values (outliers). If one test score is 0 or one house price is $10 million, the median still represents the "typical middle" better than the mean would.
Example: Incomes of 3, 5, 3, 4, 100 (in thousands)
Mean: 23 (pulled up by the 100)
Median: 4 (better represents typical income)
Mode and Range — Frequency and Spread Explained Together
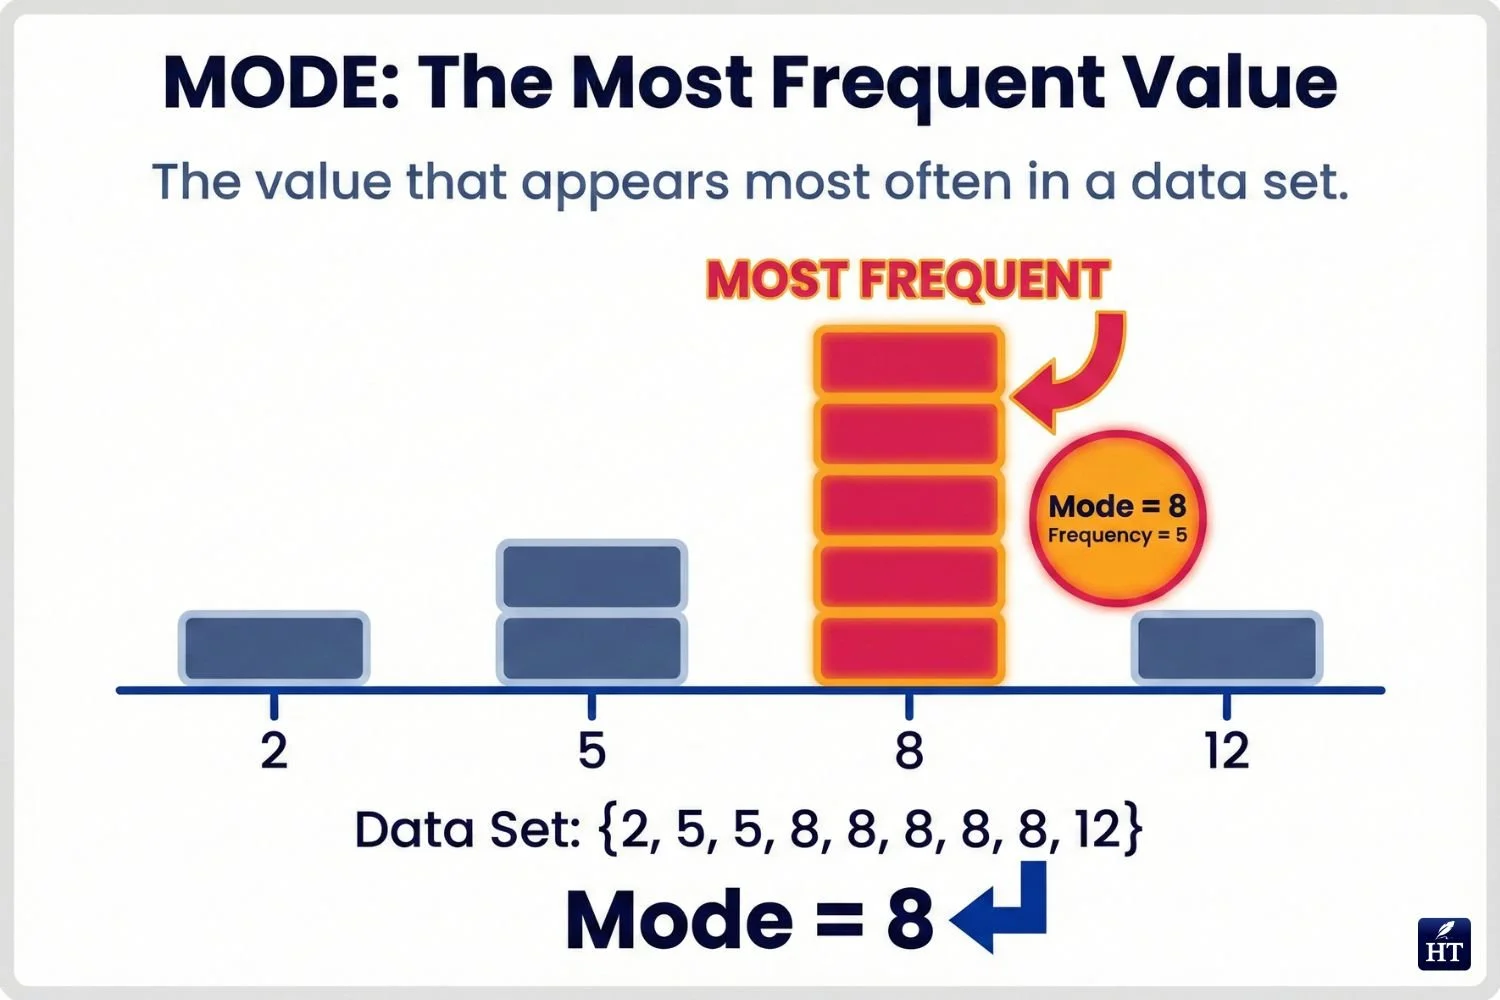
The mode is the value that appears most frequently in a data set. Unlike mean and median, mode focuses on what's most common rather than what's average or middle.
Identifying the mode:
One mode (unimodal): Data: 2, 5, 7, 5, 9, 5, 3 Mode: 5 (appears three times)
Multiple modes (bimodal or multimodal): Data: 2, 4, 4, 6, 8, 8, 10 Modes: 4 and 8 (both appear twice)
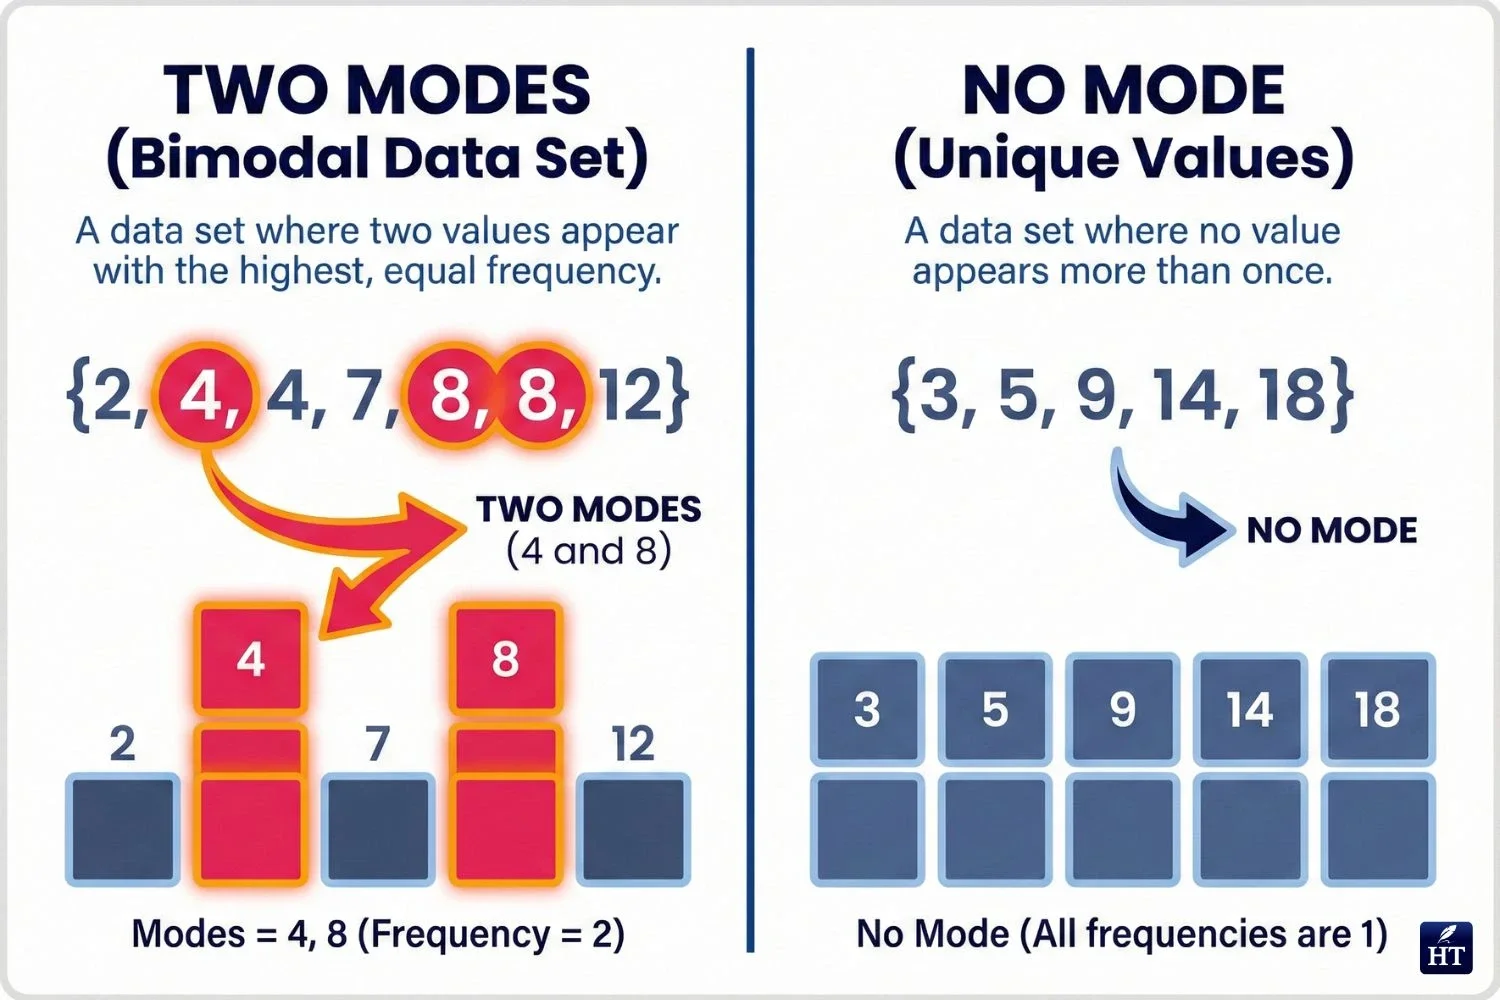
No mode: Data: 1, 2, 3, 4, 5 No mode (all values appear equally)
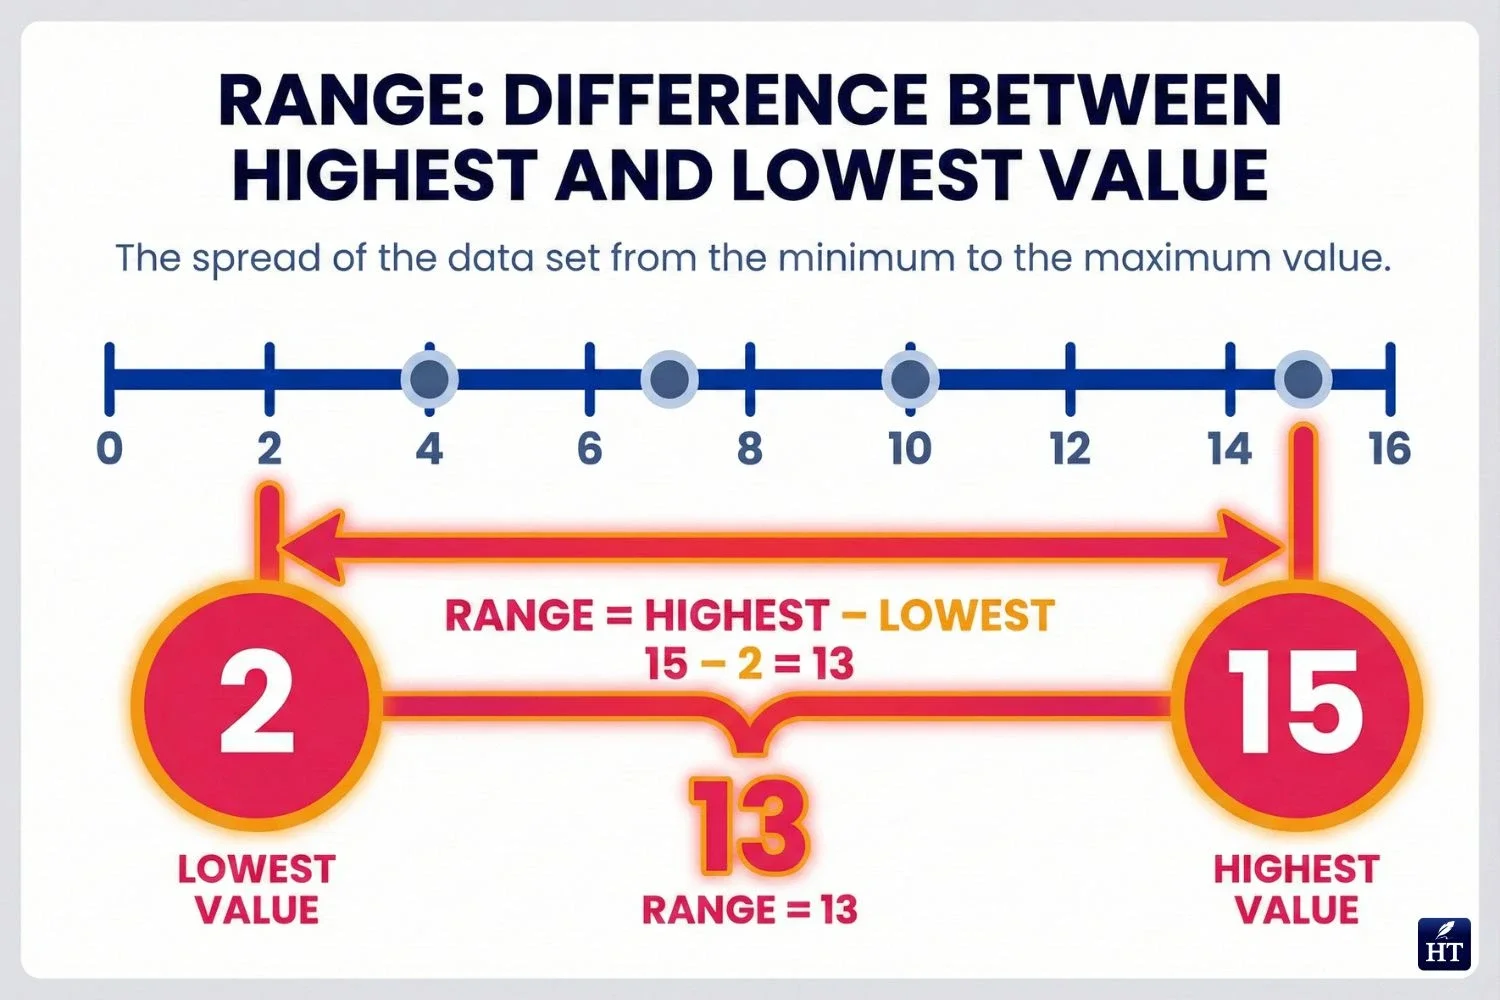
The range shows how spread out your data is—the difference between the highest and lowest values. A large range indicates wide variation; a small range indicates values are clustered together.
Formula: Range = Highest value - Lowest value
Example using the same data set: Data: 3, 7, 12, 5, 9, 12, 15
Mode: 12 (appears twice) — tells us 12 is most common Range: 15 - 3 = 12 — tells us the data spans 12 units
What mode and range tell us:
Mode reveals patterns and frequencies (useful for categorical data like shoe sizes or favorite colors)
Range indicates consistency or variation (small range = consistent data; large range = varied data)
Together with mean and median, mode and range give a complete statistical picture of any data set.
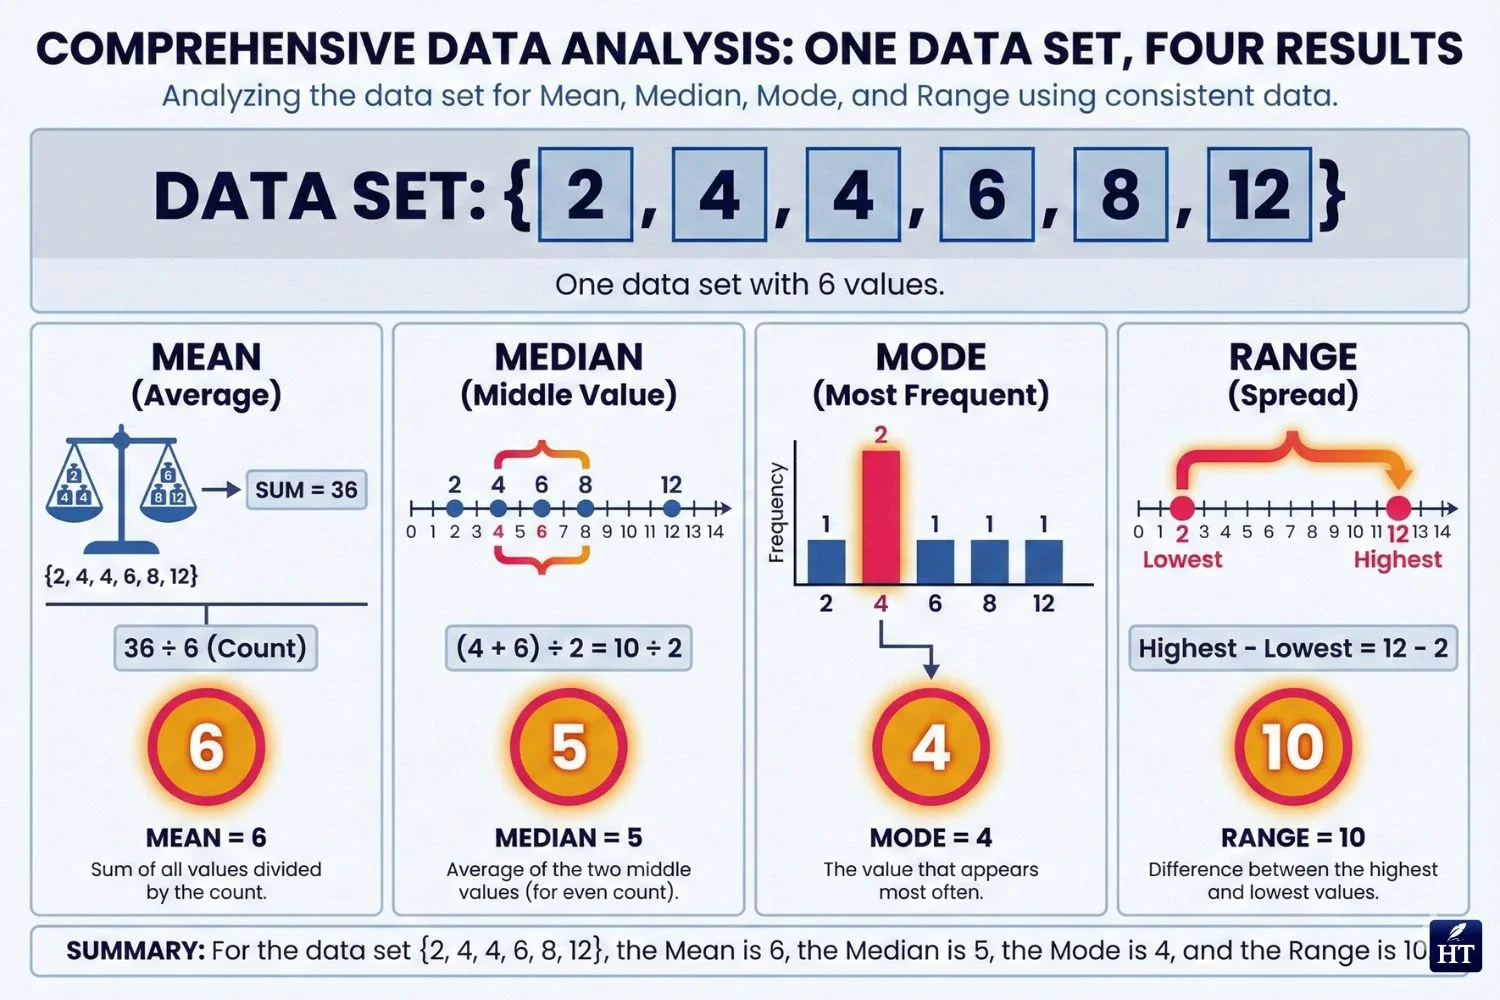
Mean, Median, Mode, and Range Comparison
Understanding what is mean mode median and range in math and what is median range mode and mean in math becomes clearer with direct comparison. Each measure answers a different question about your data.
| Measure | What It Shows | How to Calculate | When to Use |
|---|---|---|---|
| Mean | Average value; balances all numbers | Add all values, divide by count | When you want the typical value and data has no extreme outliers |
| Median | Middle value; separates upper and lower halves | Order numbers, find middle (or average two middle values) | When data has outliers or you want the true center |
| Mode | Most frequent value | Find which value appears most often | When you want to know what's most common or typical |
| Range | Spread of data; variation from lowest to highest | Subtract smallest from largest | When you want to understand how varied or consistent data is |
Key differences:
Mean is affected by every value — changing any number changes the mean Median focuses on position — only the order matters, not the exact values Mode focuses on frequency — only repetition matters Range focuses on extremes — only the highest and lowest matter
Example data set: 2, 5, 7, 7, 9, 15
Mean: (2 + 5 + 7 + 7 + 9 + 15) ÷ 6 = 45 ÷ 6 = 7.5
Median: Middle values are 7 and 7, so (7 + 7) ÷ 2 = 7
Mode: 7 (appears twice)
Range: 15 - 2 = 13
Which Measure Should You Use and When?
Choose your measure based on what you want to communicate:
Use mean when: You want the mathematical average and your data doesn't have extreme outliers (e.g., average test score, average temperature)
Use median when: Your data has outliers or you want to find the true middle value (e.g., median income, median home price)
Use mode when: You want to know what's most common or frequent (e.g., most popular shoe size, most common answer on a survey)
Use range when: You want to show how spread out or varied your data is (e.g., temperature fluctuation, price variation)
Use multiple measures together: For the most complete understanding of your data, calculate all four and compare them
Real-world application example: If analyzing class test scores where most students scored 75-85 but one student scored 20:
Mean might be 72 (pulled down by the 20)
Median might be 80 (better represents typical performance)
Mode might be 85 (most common score)
Range would be large (showing one student struggled significantly)
Worked Example Using Mean, Median, Mode, and Range
Let's calculate all four measures using one complete data set to see how they work together.
Data set: Test scores from 9 students 72, 85, 90, 78, 85, 92, 85, 88, 95
Step 1: Calculate the Mean (Average)
Add all values: 72 + 85 + 90 + 78 + 85 + 92 + 85 + 88 + 95 = 770
Count the values: 9 students
Divide sum by count: 770 ÷ 9 = 85.56 (rounded to two decimals)
Mean: 85.56
Step 2: Find the Median (Middle Value)
Arrange in order: 72, 78, 85, 85, 85, 88, 90, 92, 95
Find the middle position: With 9 values, the middle is the 5th position
Identify the median: The 5th value is 85
Median: 85
Step 3: Identify the Mode (Most Frequent)
Count frequency of each value:
72: appears once
78: appears once
85: appears three times
88: appears once
90: appears once
92: appears once
95: appears once
Mode: 85 (appears most frequently)
Step 4: Calculate the Range (Spread)
Identify highest value: 95 Identify lowest value: 72
Subtract: 95 - 72 = 23
Range: 23
Complete Summary
For the test scores 72, 85, 90, 78, 85, 92, 85, 88, 95:
Mean: 85.56 — The average score
Median: 85 — The middle score when arranged in order
Mode: 85 — The most common score
Range: 23 — The difference between highest and lowest scores
What this tells us: The class performed well overall (mean of 85.56), with 85 being both the middle and most common score. The 23-point range shows moderate variation, with the lowest score (72) being noticeably below the group but not dramatically so.
Common Mistakes Students Make
Avoiding these frequent errors improves accuracy when calculating mean, median, mode, and range:
Not ordering numbers before finding median
Mistake: Finding the "middle" of 7, 3, 9, 2, 5 without ordering first
Problem: The middle position of 9 is wrong
Fix: Always arrange from smallest to largest: 2, 3, 5, 7, 9 → median is 5
Confusing mean and median
Mistake: Thinking they're the same thing or using the terms interchangeably
Distinction: Mean is the calculated average; median is the positional middle
Example: For 1, 2, 10, the mean is 4.33 but the median is 2
Forgetting that a data set might have no mode
Mistake: Forcing a mode when all values appear equally
Truth: If no value repeats, or all values appear the same number of times, there is no mode
Example: 5, 10, 15, 20 has no mode
Thinking mode must be in the middle or near the mean
Misconception: The mode should be close to the median or mean
Reality: Mode depends only on frequency, not value size
Example: 1, 1, 1, 50, 60, 70 has mode of 1 (far from mean of 30.5)
Using range as if it's an average
Mistake: Treating range as a measure of center rather than spread
Clarification: Range shows variation, not typical value
Remember: Range = highest - lowest, nothing more
Miscounting when finding median with even numbers
Mistake: Choosing one of the two middle values instead of averaging them
Correct approach: For 2, 4, 6, 8, average the 4 and 6: (4+6)÷2 = 5
Median: 5 (not 4 or 6)
Adding instead of subtracting for range
Error: Calculating highest + lowest instead of highest - lowest
Fix: Range is always a subtraction: max - min
Conclusion
Understanding what is mean, median and mode and range in math gives you powerful tools for summarizing and analyzing any set of numerical data. The mean provides the average, the median identifies the middle value, the mode reveals the most frequent value, and the range shows how spread out your data is. Together, these four measures paint a complete picture of your data set, each highlighting different important characteristics.
Practice calculating all four measures with different data sets—test scores, temperatures, prices, sports statistics—to build confidence and fluency. Remember that each measure serves a specific purpose, and the best analysis often uses multiple measures together for comprehensive understanding.
As you become comfortable with these basics, you'll recognize them everywhere: news reports about average income (mean or median?), weather forecasts showing temperature ranges, opinion polls identifying the most popular choice (mode), and sports statistics summarizing player performance. These foundational concepts open the door to deeper statistical thinking.
Ready to explore more essential math concepts? Visit HYE Tutors for comprehensive guides on understanding mean in math, finding median values, identifying mode, calculating range, and introduction to statistics designed to strengthen your data analysis skills.
References:
Khan Academy: Mean, Median, and Mode – Comprehensive video lessons and practice
Math is Fun: Mean, Median, Mode – Interactive examples and explanations
National Council of Teachers of Mathematics: Data Analysis – Professional teaching standards